Monitoring Step 3: What to Monitor and Enabling Metrics with Prometheus
Overview
Getting data is a great start, but now I need to build out some useful visualisations and alerts. For my platform I have the following guidelines.
Dashboards: Should provide meaningful insight to an application or to the platform.
Alerts: Should be for actionable events that I care about, and given the nature of this platform I don’t want to drown in alerts… so alerting should be for very unusual events.
What data do I have, and is anything missing?
I have a reasonable volume of log data, but as I will encounter in more detail below I am lacking ready access to the metrics that the platform exposes and these are more useful for some of my early efforts.
Right now the logging platform is capturing:
- All application events within the cluster that are generated in worker nodes.
- All system level events from the underlying worker nodes for service “kubelet”
_SYSTEMD_UNIT=kubelet.serviceThis is a good starting point for monitoring the applications deployed to the platform, but is missing a few elements:
- The control pane: If I want to keep an eye on access and the underlying health of the kubernetes cluster, the management nodes should also be shipping log data.
- A broader net on the underlying instances: Right now I’m only pulling data from a single systemd source, there’s probably other elements I’d be interested in monitoring here… at least the state of each SSH server.
I’ll look into adding that information in a later post, so for now I’ll focus on monitoring, dashboards and alerting for the platforms and services I have live.
Theories,Hypotheses and the Unknown
I have a mix of thoughts on how the cluster should run and what could become a problem. I’ll break these down into what I would term:
- Theories: Things that are well defined, repeatable and testable. These are prime candidates for alerts, and in most cases these are tied to pre-existing metrics. If there is not a metric or series of metrics that can provide these then it is a fairly safe bet that I’m on the wrong path.
- Hypotheses: Educated guesses at how an optimal setup should run. These items are more likely going to be built into dashboards and used to build a more solid understanding of how the reality and my expectations marry up. I expect these to be a mix of metrics and log data.
- Unknowns: There are things I’d like to validate and test further before I can even form an educated guess about how they will or will not work – these will likely lean far more heavily on log data and use a combination of dashboarding and log inspection to puzzle out, and may require tweaking of log levels to get the right data to drive insight.
I’d like to start with an extremely simple set of requirements. There will be plenty of opportunity to scale up from there as required.
Theories
- All nodes should be online and in a ready state
- Criteria: Any node reported as not ready.
- Frequency: Once per hour, per node.
- All nodes should have sufficient free resources to be able to run.
- Criteria: CPU, RAM, free disk space, and system temperature are within tolerances.
- Frequency: Twice per day, per node.
- Pods should not restart more than once per day.
- Criteria: Restart frequency > 1 in the last 24 hours.
- Frequency: Once per pod per day.
- Kubectl and API access should be limited to known sources.
- Criteria: Inbound connections to the API endpoint should alert if not part of a whitelist of IP ranges.
- Frequency: Whenever this event occurs.
Hypotheses
- WikiJS app should run on a single pod without consuming more than 100% of a single CPU core or more than 1GB of memory.
- Visualisation: stacked bar chart.
- Nginx Mapper application should not serve more than 1000 requests in one hour.
- Visualisation: line graph.
- Mariadb database application should not list any errors or warnings.
- Visualisation: A mix of aggregate cards and a stacked bar chart.
- Etcd System application should not encounter any errors or warnings.
- Visualisation: Identical to Mariadb.
Initial Unknowns I’d like to understand better:
- What is attempting to connect to the gateway ports exposed to the internet
- Requirements for inspection: Additional log ingestion from my router and gateway metrics if available.
- Where are my biggest culprits for use of CPU, Memory and Bandwidth per hour.
- Requirements for inspection: Kubernetes kubelet metrics.
What am I missing? Metrics
While I have a relatively good handle on log data, one of the key things I’m missing is ready access to the metrics available from the kubernetes cluster at kubelet and admin level. While Opensearch can manage these, it leverages prometheus to do so, which means it is time to add a new product to my monitoring tool set.
Up and Running with Prometheus
Where Opensearch is built more around the storage of document data, Prometheus is built to focus more on numeric based metrics.
Thankfully there is a pre-built helm chart that will give a starting point for the platform, but this will require some customization and hardening before this is considered reasonably secure – I’d strongly recommend at the very least ensuring an override/replace the secrets related to grafana login, and to keep access to the platform restricted.
For now though, invoking the helm chart can help obtain some quick insights into what is available in metric data for the the platform and I can then start to build out what system should be responsible for each area I’d like to monitor, or to learn more about.
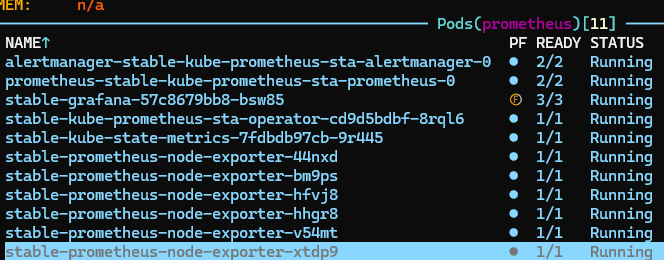
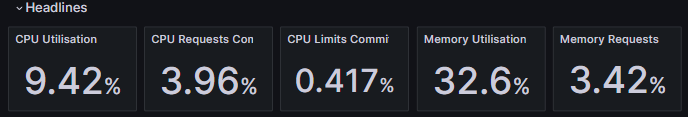
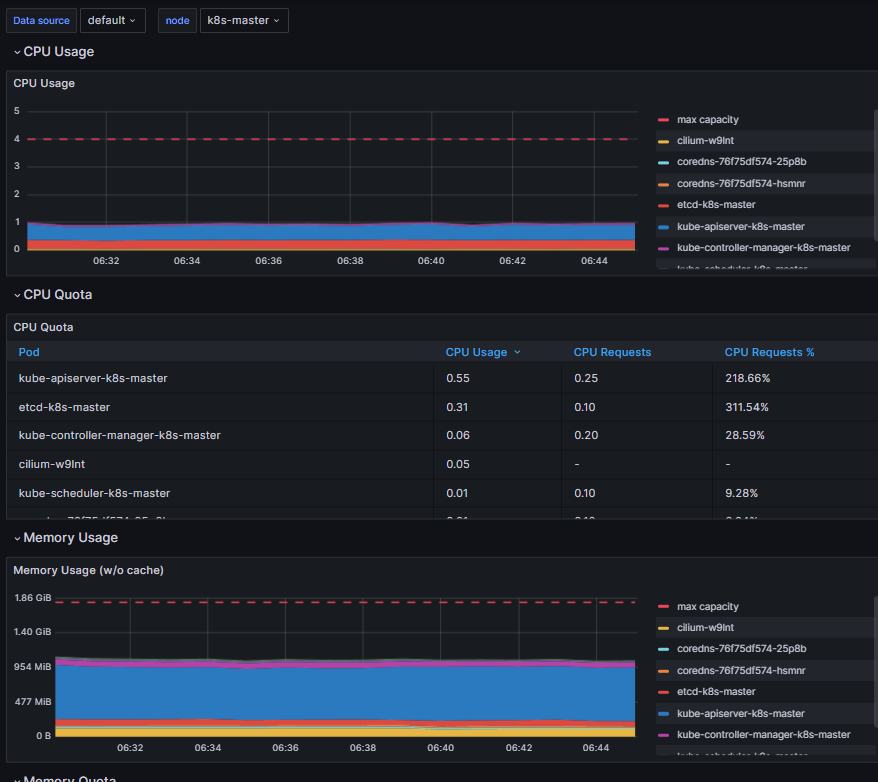
With prometheus up and running, a port forward of the Grafana UI to my local system I can then start to review some of the built in alerts and dashboards. There’s more data here than I need right now, but I should be able to build out a small subset that can provide the information I require.
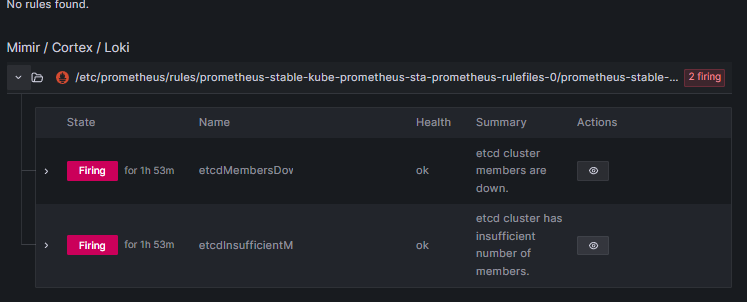
Right now the firing alerts from the default set seem to indicate a permissions issue with the platform. For example the platform is currently reporting etcd as down, but the platform’s single instance running on the master node is working correctly, so there is likely further configuration required here, possibly that prometheus needs the TLS certs for etcd, but it looks like a possible role or configuration issue to me as other services are also not ‘visible’ at this stage.
What is next
So for the next day or two it looks like my work is fairly clear. I need to ensure that I have prometheus customised to my requirements, and that the appropriate metrics and services are enabled, and from there I should be able to identify whether to leverage Prometheus or Opensearch for each of the above elements I’d like to test.
At this point I would guess that prometheus is going to be most valuable in managing the known elements at my theories end of requirements, with the log data becoming more valuable the more I get into the unknowns at the other end of the spectrum. But it will be interesting to see how this all pans out.